
Informatica Cloud Redshift Trial For Yellowfin
Posted by: Informatica Marketplace Admin
The Informatica Cloud 60 days trial allows you to reliably and quickly import data into Amazon Redshift from on-premises enterprise systems or other cloud applications. Yellowfin is a 100% web-based platform ideal for Business Intelligence and analytics in the cloud with ability to read from Amazon Redshift. Using both these trials and the dashboard prototype visualize your Salesforce data in minutes.
Overview
Informatica Cloud with Amazon Redshift connector TrialLeveraging the power of the award-winning Informatica Cloud Platform, the Informatica Cloud 60-Day Trial for Amazon Redshift enables organizations to quickly and reliably import data into Amazon Redshift from on-premises enterprise systems and other cloud applications.You can use the Informatica Cloud Trial and load Salesforce data into Redshift to make it available for Yellowfin to provide data visualization. Yellowfin for Amazon AWS TrialYellowfin is a 100% web-based platform ideal for Business Intelligence and analytics in the cloud. Using the trial link above, launch your free trial version of Yellowfin directly from the AWS marketplace and get started in minutes with your free trial that enables 3 users to create and share unlimited reports and dashboards for 12 months. Then upgrade at anytime to seamlessly scale throughout your enterprise. SalesForce Dashboard PrototypeInformatica Cloud Trial provides the ability to connect to Salesforce and Amazon Redshift. Yellowfin provides the ability to visualize the Salesforce data in Redshift using Dashboards and reportsIn the resources section, you can download the implementation guide for configure the Prototype.In Informatica cloud you can use the Salesforce connector, Redshift connector and Informatica Cloud bundle to load data into Redshift.Once the Amazon Redshift is populated with Salesforce data, you can use Yellowfin dashboard to view the data. Informatica Cloud Redshift ConnectorThe Redshift connector is a bulk-load type connector that allows you to perform inserts, deletes, and upserts (insert and/or update). The connector provides upsert functionality by first creating and loading a staging table, and then merging that with the existing table.Access to Redshift data is available via high performance ODBC or JDBC PostgreSQL drivers.
- Seemless interoperability with Amazon Redshift.
- High performance data synchronization.
- The only solution to provide ?Upsert? (insert and/or update) functionality.
- Step by step integration wizards for non-technical users.
- Advanced point and click integration workflows for technical users.
Features
100% browser-based
Deployed on a centralized architectureDesigned for business users
Interactive Dashboards
Filter, drill-down, drill-through, drill-anywhere, pinch, etcData Discovery
Connect to your data source and easily create charts and dashboardsGovernance and Security
Securely connect to data and manage users with data level security, content level security, user level securityMeta-data layer
re-use business logic for enterprise BIMobile BI
Award-winning mobile applicationLocation Intelligence
Create dynamic maps on any report or dashboardCollaborative BI
View, share, make comments and make collaborative decisions with colleaguesTimeline
Connect with users and have threaded discussion on an Yellowfin's social platform .Storyboard
Tell stories with interactive data .Automated scheduling
Schedule reports and tasksApproval wrokflows
create approval workflows to ensure trust in your reports .Embedded BI
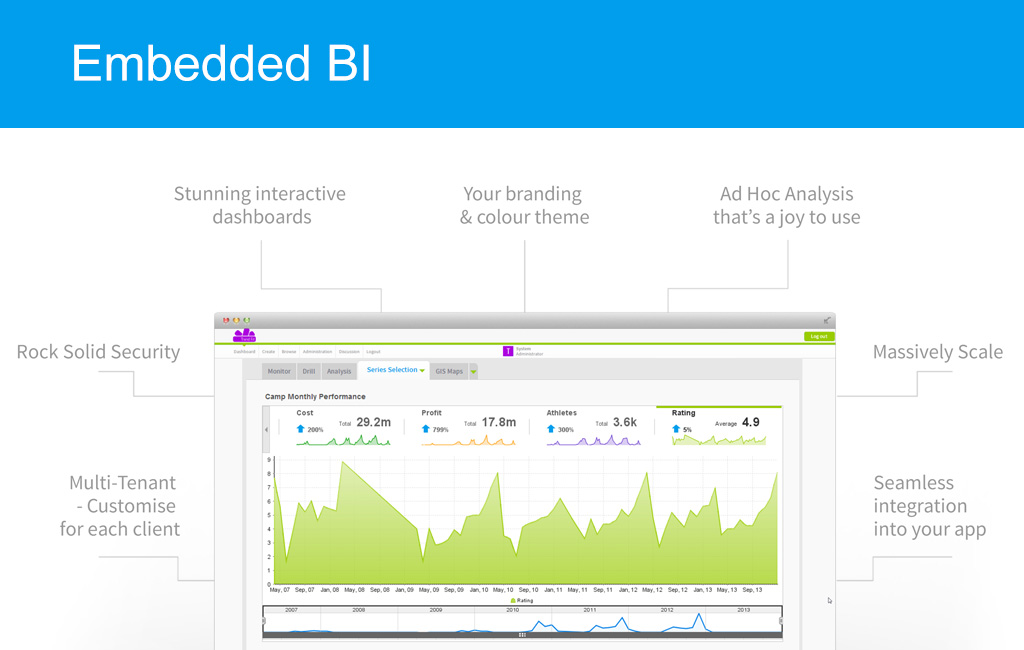
Rebrand, restyle and integrate Yellowfin seamlessly into your application via javascript API or web servicesMulti-Tenant
Customize Yellowfin for each client .Take the cost out of BI
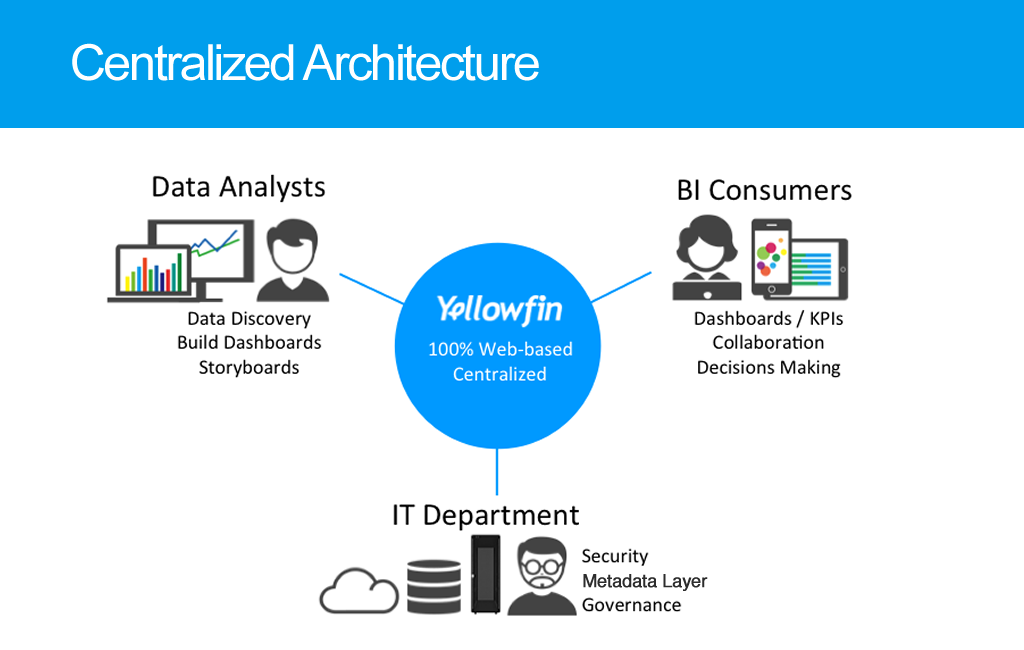
Yellowfin's pricing model is simple and affordable . 1. Awesome DashboardsPeople come to Yellowfin because they want awesome dashboards. Our dashboards are highly interactivce – filter, drill to detail, and analyze right in a browser. With Yellowfin, you can go from data to dashboards in hours; not weeks or months.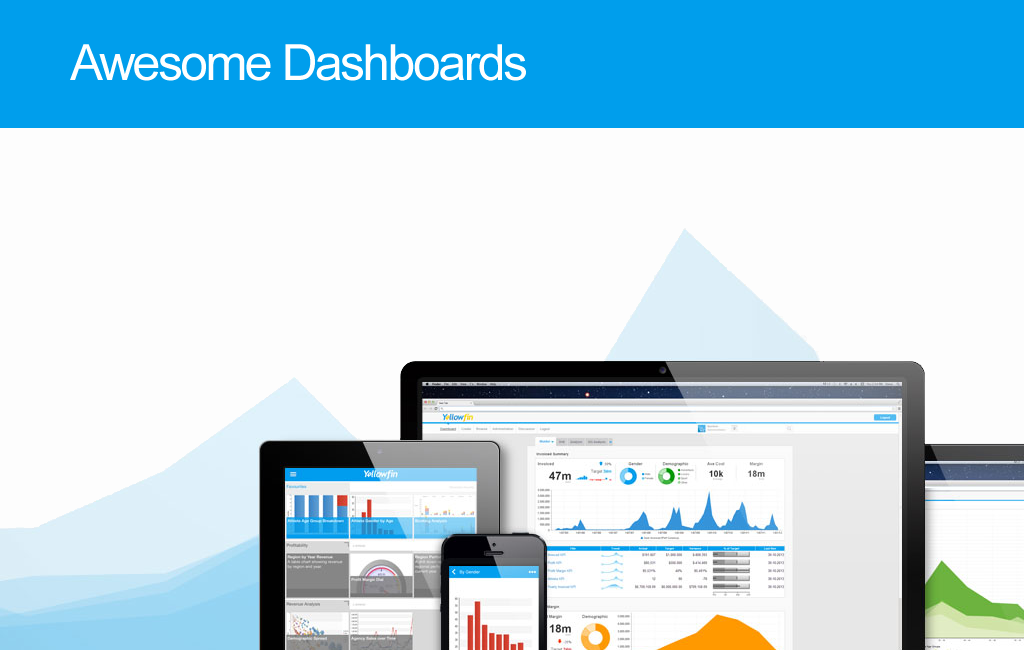 2. Centralized ArchitectureYellowfin’s is 100% browser-based and deployed from a centralized architecture. This architecture gives analysts the data discovery tools they want to create reports, dashboards and tell stories with data. And it gives IT complete control over security and governance which is required for enterprise deployment. Best of all, Yellowfin gives non-technical BI consumers a platform to access, interactive and collaborate with colleagues in a secure and trusted platform.
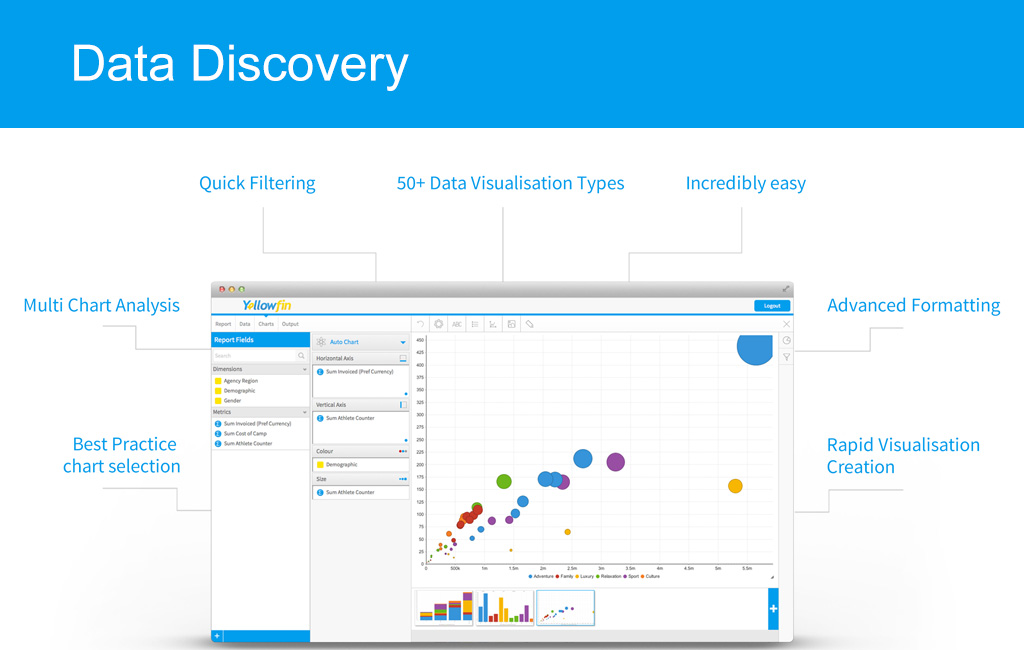
  3. Data DiscoveryData visualization is not only a great way to present your data, but a powerful way to explore it as well. Yellowfin’s data visualization lets you spot outliers and trends with ease. With over 50 chart types – from sophistated trellis charts, to popular line and meter charts – the right visualization is just a click away.
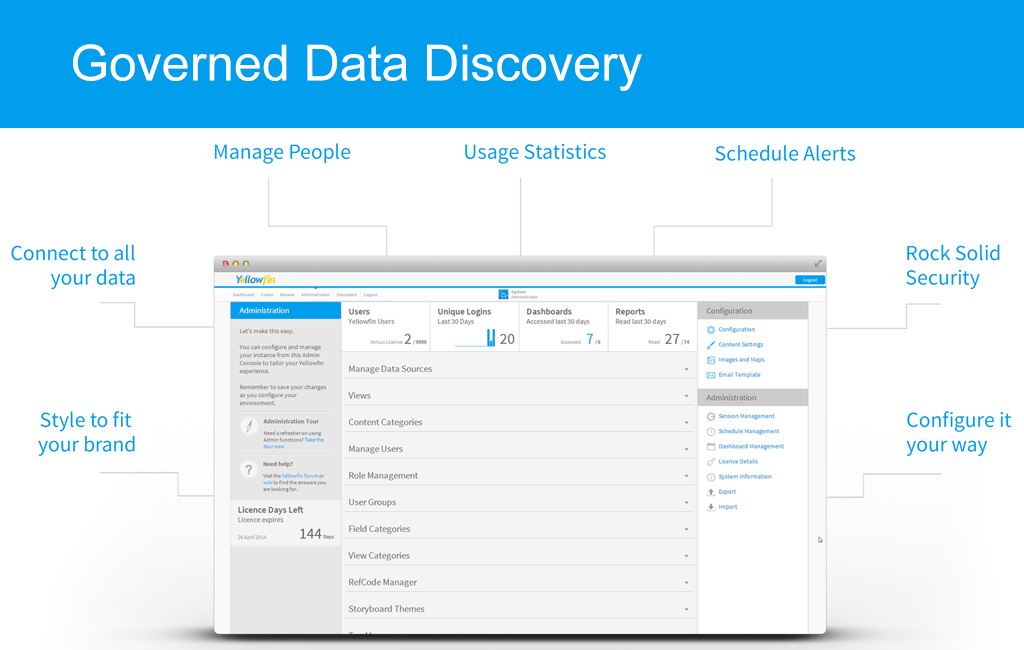
  4. Governed Data DiscoveryYellowfin is different. Unlike most BI products, we deliver all the BI functionality you need via a single-integrated platform. This means the Busines Users have a great user experience whilst providing IT the governance they need to ensure trust in the platform and data security.
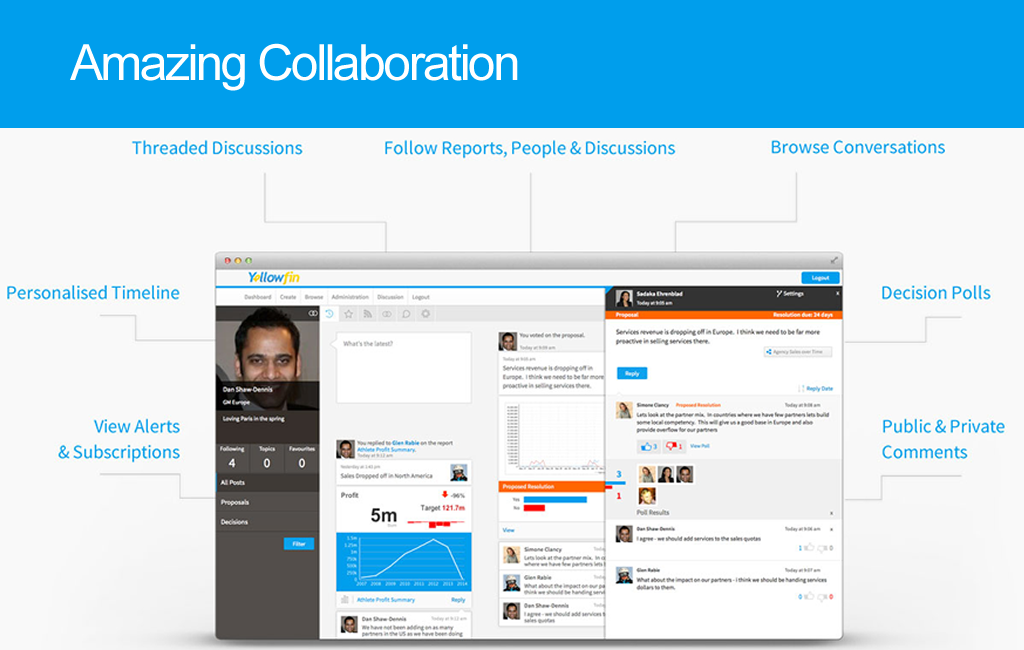
  5. Amazing CollaborationImagine what your people could do when they collaborate with your data. Providing visibility is one thing – but engaging in conversation, acting on data and sharing knowledge is what really makes the difference. Yellowfin helps you do this and more. Yellowfin is the leader in collaborative BI.
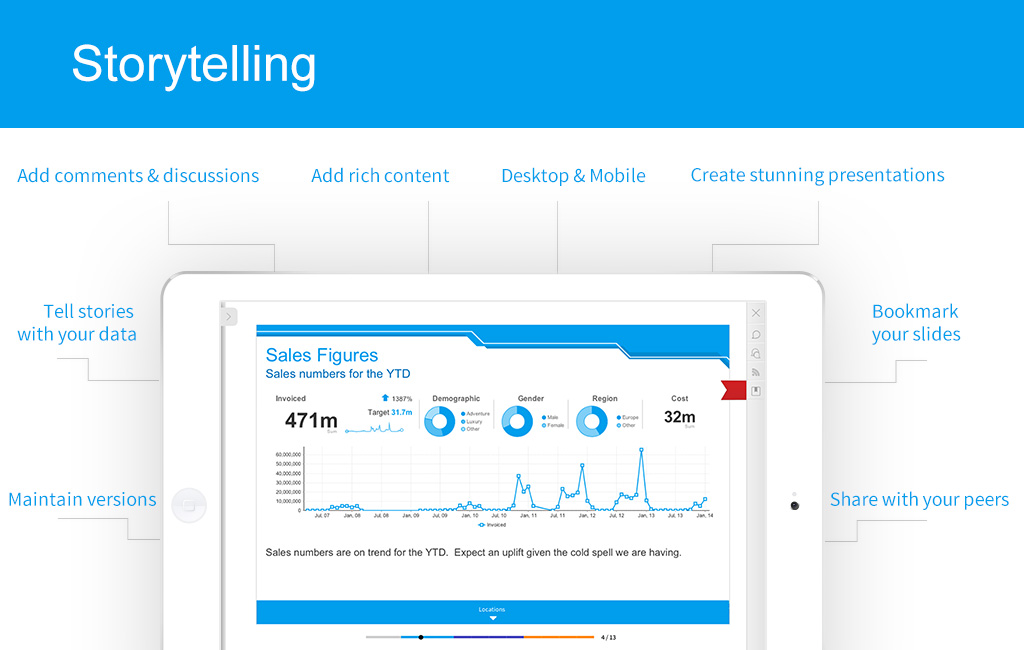
  6. Storytelling with DataYellowfin was the first BI platform to include interactive storytelling features into its platform. Create stunning PowerPoint-like presentations and tell stories with real-time and interactive data. Don’t bring the data to your presentation, bring the presentation to your data.
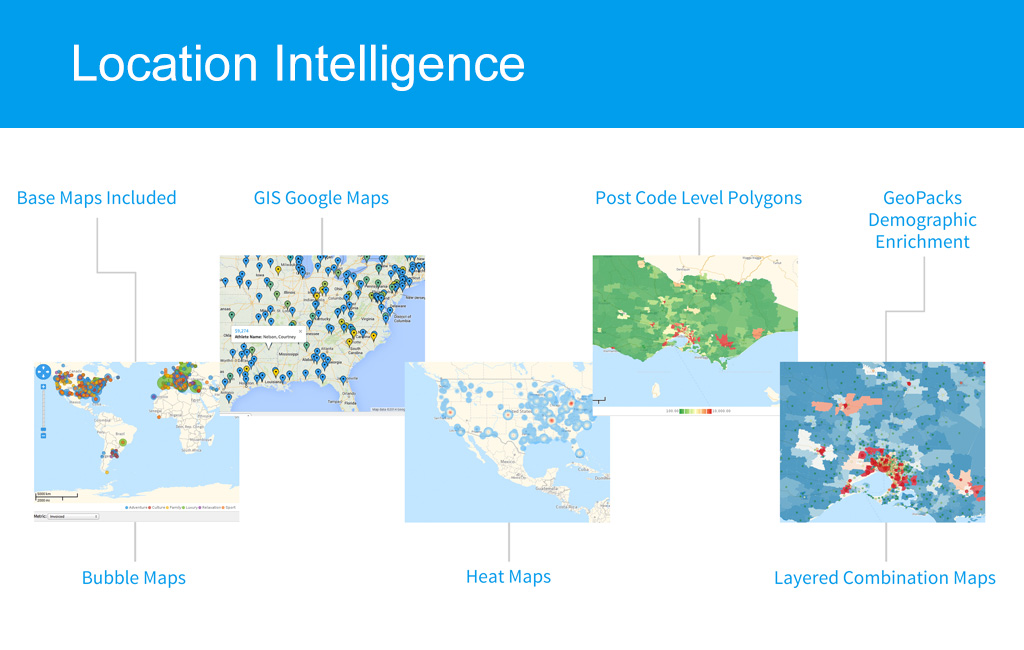
  7. Location IntelligenceYellowfin’s award winning Location Intelligence makes it easy for you to put dynamic maps onto any report or dashboard. Merging your spatial data with your transactional Business Intelligence data willput your business on the map.
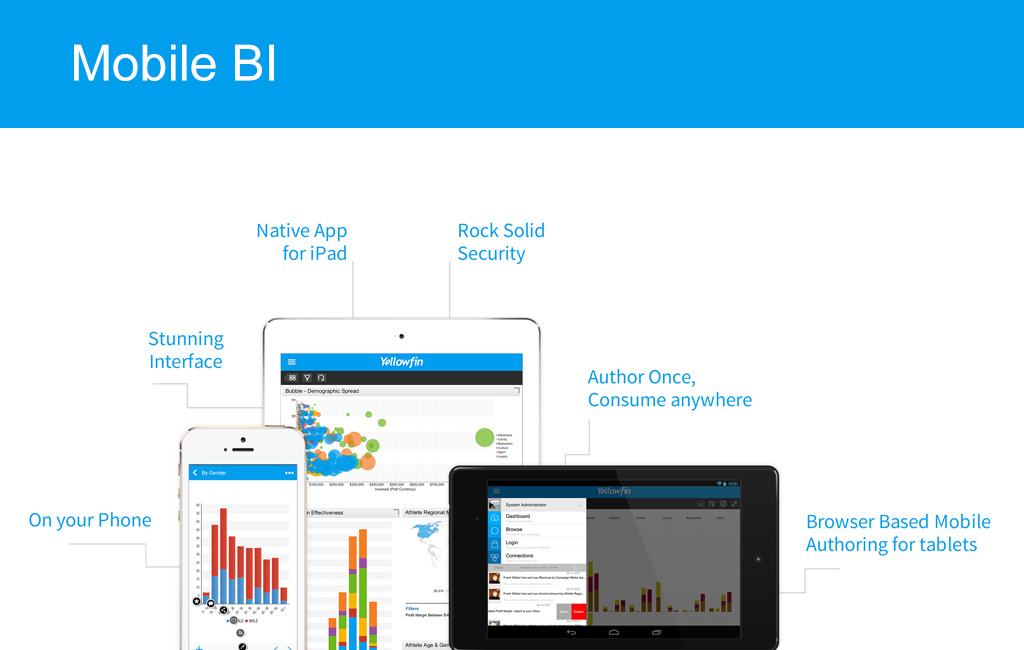
  8. Mobile BIYou will like Yellowfin’s mobile app. It combines outstanding collaborative features with great usability – simply swipe to browse dashboards, filter with a tap of a finger, or pinch and zoom. Our unique approach means that as soon as you publish a report it’s enabled on your favorite mobile device immediately.
  9. Embedded BIFill the gaps in your application’s reporting functionality. Integrate sleek interactive dashboards, ad-hoc and GIS reporting, as well as Mobile BI via iPad, iPhone, Android or standard Web-browser.
  10. Cloud BIBARC’s The BI Survey 14 have rated Yellowfin as the top Cloud BI vendor for the last 3 years. Deployed from a centralized architecture, and consumed via a browser, Yellowfin makes it easy to deploy and scale either in the cloud or on-premise.
System Requirements:
- Yellowfin is available on any platform (Windows, Linux, Mac)
- Yellowfin for AWS is deployed on Linux
Resources
Support
Yellowfin is a global Business Intelligence (BI) and analytics software vendorpassionate about making BI easy. Founded in 2003 in response to the complexity and costs associated with implementingand using traditional BI tools, Yellowfin is a highly intuitive 100 percent Web-based reporting and analytics solution.Yellowfin offers a fresh and agile approach to enterprise BI. Yellowfin gives analysts the data discovery features they want to quickly create reports and dashboards, while giving IT complete control over governance and security. This provides business end users with a trusted and highly interactive BI platform < Headquarters Yellowfin International, Level 46, 360 Elizabeth Street,Melbourne VIC 3000Australia http://www.yellowfinbi.comhttp://www.yellowfinbi.com/YFSupportCentre.i4 support@yellowfin.bi http://www.yellowfinbi.com/YFSupportCentreTutorials.i4 http://www.yellowfinbi.com/ http://www.yellowfinbi.com/YFSupportCentreTutorials.i4
